Liam
24 Oct, 2015

PHPStorm Xdebug Vagrant
Xdebug
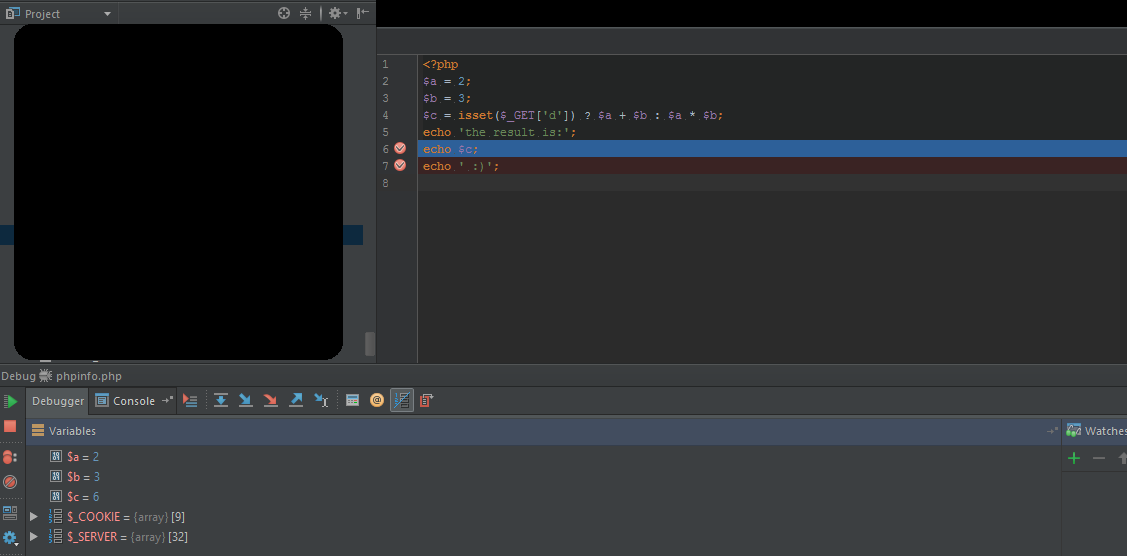
Xdebug is a PHP extension which provides debugging and profiling capabilities. Most PHP IDE has built in integration with Xdebug, it works as below:
- set breakpoints at IDE
- click debug
- at breakpoint, variables details are shown and pausing the web application

- resume and continue to next breakpoint
At vagrant
yum install php-devel
yum install php-pear
yum install gcc gcc-c++ autoconf automake
pecl install Xdebug
#/etc/php.d/xdebug.ini
[xhprof]
zend_extension="/usr/lib64/php/modules/xdebug.so"
xdebug.remote_enable = 1
xdebug.remote_connect_back = on
xdebug.idekey = "PHPSTORM"
xdebug.remote_handler=dbgp
xdebug.remote_host=10.0.2.2
xdebug.remote_port=9001
service httpd restart
At PHPStorm
- File > Settings > Language & Frameworks > PHP > Servers: setup

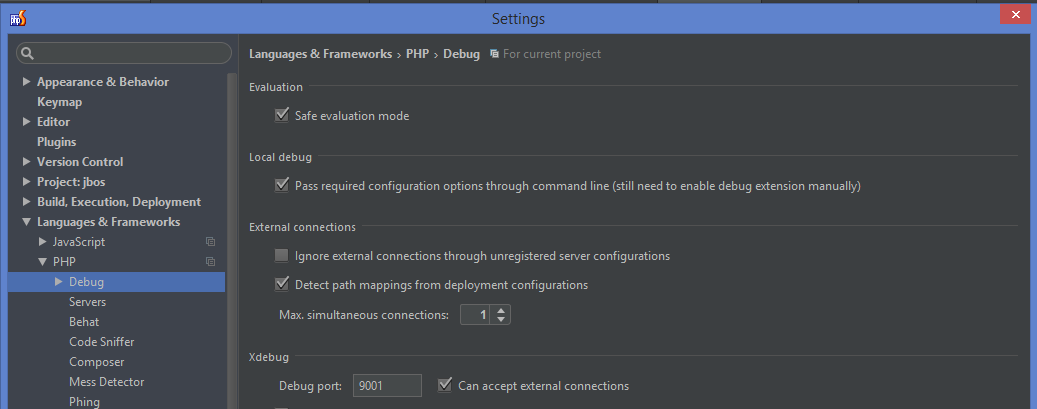
- File > Settings > Language & Frameworks > PHP > Debug
- debug port: 9001
- check "Can accept external connections"

- Run > Start Listening to PHP Debug Connections
At Chrome (or other browser)
- Install Xdebug Helper
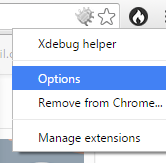
- Right click the new red bug in the browser > options: change IDE key to PhpStorm

- Go to your development website
- Left click the red bug > Debug
- Refresh website and you shall see web application paused, switch to IDE and you shall see the debug detail there.